Module: graph
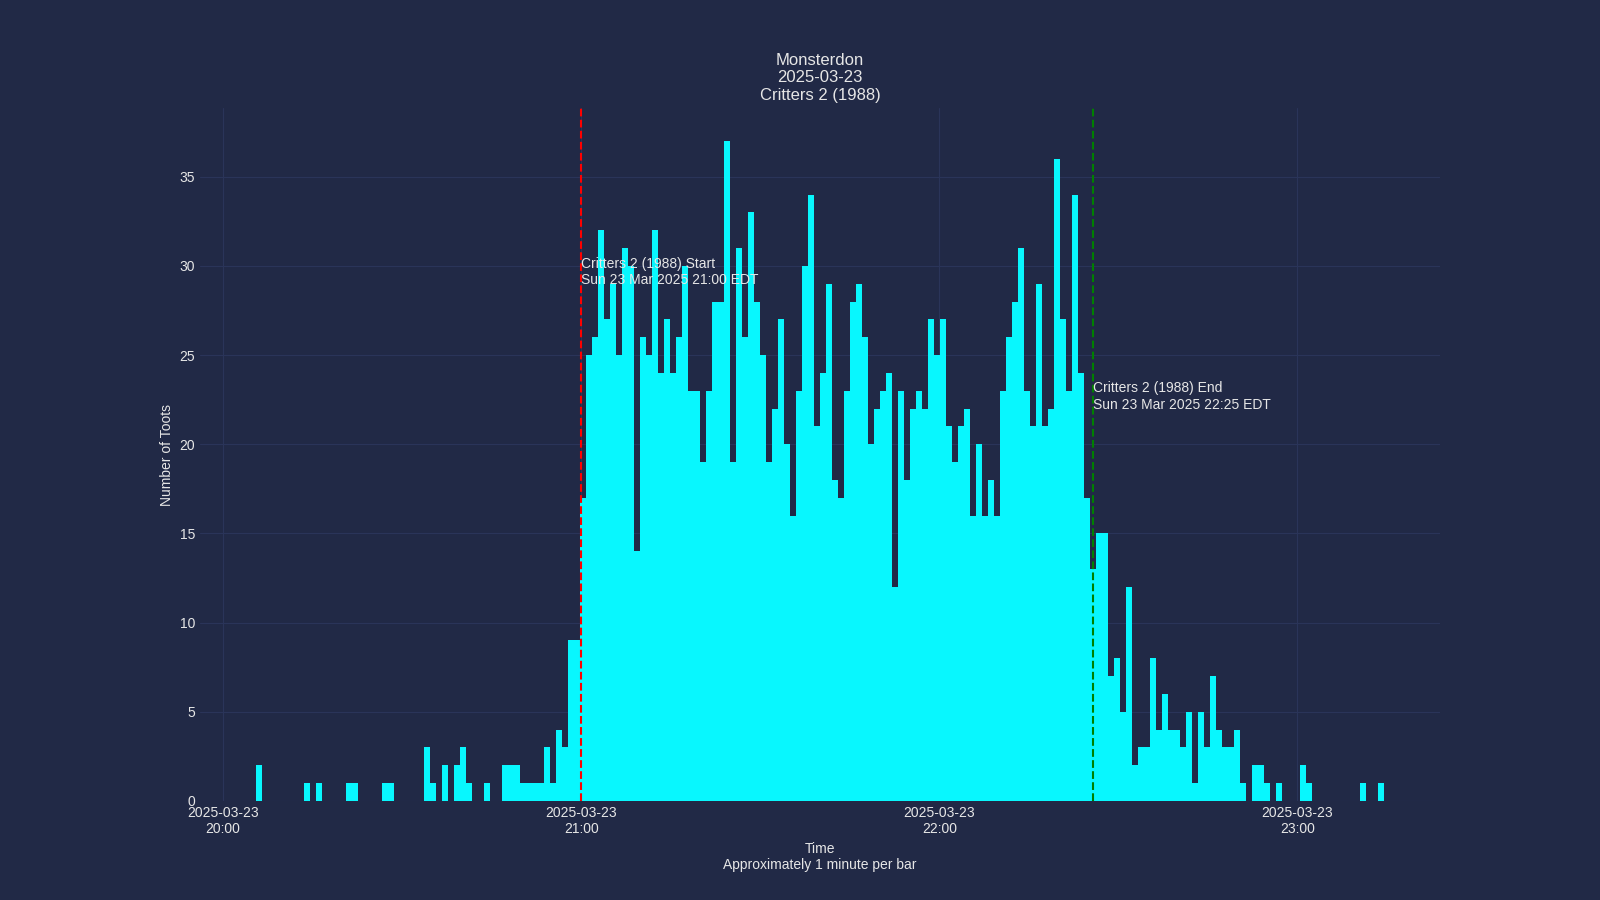
The graph module creates a histogram visualization of toot activity over time. It generates a histogram showing the frequency of toots during the analyzed period, with vertical lines marking the start and end times of the event.
Alt Text Generation
The graph module automatically generates descriptive alt text for each graph. This alt text includes:
- The hashtag and date of the analysis
- Duration in minutes between start and end times
- Total number of posts during the event period
- Highest activity (maximum posts in a minute)
- Lowest activity (minimum posts in a minute)
- Average posts per minute
- The graph title
The alt text is saved to a text file with the same name as the graph but with a .txt extension. For example, if the graph is saved as graph-exampletag-20250409.png, the alt text will be saved as graph-exampletag-20250409.txt.
Output Files
The graph module produces two files for each analysis:
- PNG Image:
graph-hashtag-YYYYMMDD.png- The visual representation of toot activity - Alt Text:
graph-hashtag-YYYYMMDD.txt- Descriptive text summary of the graph
Code Reference
Module to take the data in from analysis and produce a histogram of activity.
get_random_font(config)
Get a random font from the fonts list in config.
Source code in mastoscore/graph.py
def get_random_font(config:ConfigParser) -> str:
    """Get a random font from the fonts list in config."""
    fonts_str = config.get("wordcloud", "fonts")
    fonts = [f.strip() for f in fonts_str.split(',')]
    return choice(fonts)
graph(config)
This is the main function, for now. It invokes get_toots_df()
to get the DataFrame. Then it discards basically everything other than the created_at dates.
It plots a histogram using some jiggery pokery that I adjust manually almost every time.
I'm trying to use cool matplotlib themes that I found here.
Config Parameters Used
| Option | Description |
|---|---|
graph:timezone |
The timezone that all times will be converted to. |
graph:start_label |
Label for the event_start vertical line |
graph:end_label |
Label for the end_time vertical line |
graph:graph_title |
Title for the graph |
wordcloud:fonts |
Path to fonts. Used for title |
mastoscore:hashtag |
Hashtag used for the analysis |
mastoscore:event_year |
Year of the event (YYYY) |
mastoscore:event_month |
Month of the event (MM) |
mastoscore:event_day |
Day of the event (DD) |
Parameters:
| Name | Type | Description | Default |
|---|---|---|---|
config
|
ConfigParser
|
A ConfigParser object from the config module |
required |
Returns:
| Type | Description |
|---|---|
None
|
None |
Writes the graph out to a file named graphs/hashtag-YYYYMMDD.png Also writes alt text description to graphs/hashtag-YYYYMMDD.txt
Source code in mastoscore/graph.py
def graph(config:ConfigParser) -> None:
    """
    This is the main function, for now. It invokes [get_toots_df()](module-analyse.md#mastoscore.analyse.get_toots_df)
    to get the DataFrame. Then it discards basically everything other than the `created_at` dates.
    It plots a histogram using some jiggery pokery that I adjust manually almost every time.

    I'm trying to use cool matplotlib themes [that I found here](https://github.com/akasharidas/dark-matplotlib-styles).

    ## Config Parameters Used

    | Option | Description |
    | ------- | ------- |
    | `graph:timezone` | The timezone that all times will be converted to. |
    | `graph:start_label` | Label for the event_start vertical line |
    | `graph:end_label` | Label for the end_time vertical line |
    | `graph:graph_title` | Title for the graph |
    | `wordcloud:fonts` | Path to fonts. Used for title |
    | `mastoscore:hashtag` | Hashtag used for the analysis |
    | `mastoscore:event_year` | Year of the event (YYYY) |
    | `mastoscore:event_month` | Month of the event (MM) |
    | `mastoscore:event_day` | Day of the event (DD) |

    Args:
      config: A ConfigParser object from the [config](module-config.md) module

    Returns:
      None

    Writes the graph out to a file named graphs/hashtag-YYYYMMDD.png
    Also writes alt text description to graphs/hashtag-YYYYMMDD.txt
    """

    timezone = config.get("mastoscore", "timezone")
    start_label = config.get("graph", "start_label")
    end_label = config.get("graph", "end_label")
    graph_title = config.get("graph", "graph_title")
    font_path = get_random_font(config)

    # Get hashtag and date components for filename
    try:
        hashtag = config.get("mastoscore", "hashtag")
        year = config.get("mastoscore", "event_year")
        month = config.get("mastoscore", "event_month")
        day = config.get("mastoscore", "event_day")
        date_str = f"{year}{month}{day}"
    except Exception as e:
        raise RuntimeError(f"Didn't get times from config. {e}") from e

    logger = get_logger(config, __name__)
    df = get_toots_df(config)

    timedata = df[["created_at"]].sort_values(by=["created_at"])
    # all we care about is time data, so we delete the whole dataframe. :)
    del df
    timedata.insert(1, "id", 1)
    tootdata = timedata.to_numpy()
    timestamps = tootdata[:, 0]
    (oldest, newest) = timestamps[:: len(timestamps) - 1]

    # Get graph times, then round to 0 seconds
    start_time, end_time = get_graph_times(config)
    graph_start = start_time.replace(second=0, microsecond=0)
    graph_end = end_time.replace(second=0, microsecond=0)

    # Get font
    try:
        title_font = FontProperties(fname=font_path, size=16)
    except Exception as e:
        logger.warning(f"Could not load font from {font_path}: {e}. Using default font.")
        title_font = FontProperties(size=16)

    delta = graph_end - graph_start
    dates = [
        graph_start + datetime.timedelta(hours=i)
        for i in range(int(delta.total_seconds() / 3600) + 1)
    ]
    d1str = datetime.datetime.strftime(newest, "%H:%M on %Y-%m-%d")
    d2str = datetime.datetime.strftime(oldest, "%H:%M on %Y-%m-%d")
    logger.info(
        f"from {d2str} to {d1str} with {delta.total_seconds() / 3600} hours"
    )
    plt.rcParams["timezone"] = timezone
    plt.figure(figsize=(16, 9))
    plt.style.use(
        {
            "axes.facecolor": "#1a1a1a",
            "axes.edgecolor": "gray",
            "axes.labelcolor": "white",
            "text.color": "white",
            "xtick.color": "#a0a0f0",
            "ytick.color": "tab:blue",
            "grid.color": "gray",
            "figure.facecolor": "#1a1a1a",
            "figure.edgecolor": "#1a1a1a",
            "savefig.facecolor": "#1a1a1a",
            "savefig.edgecolor": "#1a1a1a",
        }
    )
    plt.title(f"{graph_title}", fontproperties=title_font)
    plt.xlabel("Time\n1 minute per bar", fontsize=16)
    plt.ylabel("Number of Toots", fontsize=16)
    plt.xticks(dates, dates)
    plt.grid(True)
    ax = plt.subplot()

    # Create minute bins
    total_minutes = int((graph_end - graph_start).total_seconds() / 60)
    minute_bins = [
        graph_start + datetime.timedelta(minutes=i) for i in range(total_minutes + 1)
    ]

    # Count posts per minute
    minute_counts = {}
    for ts in timestamps:
        # Round down to the nearest minute
        minute_key = ts.replace(second=0, microsecond=0)
        if minute_key in minute_counts:
            minute_counts[minute_key] += 1
        else:
            minute_counts[minute_key] = 1

    # Create x and y values for the histogram
    x_values = minute_bins[:-1]  # All but the last bin edge
    y_values = [
        minute_counts.get(x, 0) for x in x_values
    ]  # Get count or 0 if no posts in that minute

    # Plot the histogram
    _ = ax.bar(
        x_values, y_values, width=1 / 1440
    )  # width is 1 minute as fraction of day

    # Calculate and plot 15-minute moving average
    if len(x_values) >= 30:
        # Create moving average data
        ma_window = 15  # 15-minute window
        ma_y_values = []
        ma_x_values = []

        for i in range(ma_window - 1, len(y_values)):
            # Calculate average of the last 15 minutes
            window_avg = sum(y_values[i - (ma_window - 1) : i + 1]) / ma_window
            ma_y_values.append(window_avg)
            ma_x_values.append(x_values[i])

        # Plot the moving average as a yellow line
        ax.plot(
            ma_x_values, ma_y_values, "y", linewidth=2, label="15-min Moving Average"
        )
    else:
        logger.warning(
            f"Not enough data points for 15-minute moving average (need at least 15, got {len(x_values)})"
        )

    event_start = get_event_start(config)
    event_end = get_event_end(config)

    # Find highest and lowest points between start and end times
    event_x_values = [x for x in x_values if event_start <= x <= event_end]
    event_y_values = [minute_counts.get(x, 0) for x in event_x_values]

    highest_point = max(event_y_values)
    highest_index = event_y_values.index(highest_point)
    highest_time = event_x_values[highest_index]

    lowest_point = min(event_y_values)
    lowest_index = event_y_values.index(lowest_point)
    lowest_time = event_x_values[lowest_index]

    # Calculate relative times from event start
    highest_relative = highest_time - event_start
    highest_minutes = int(highest_relative.total_seconds() // 60)
    highest_seconds = int(highest_relative.total_seconds() % 60)

    lowest_relative = lowest_time - event_start
    lowest_minutes = int(lowest_relative.total_seconds() // 60)
    lowest_seconds = int(lowest_relative.total_seconds() % 60)

    logger.info(
        f"Highest point: {highest_point} posts at {highest_time.strftime('%H:%M:%S')} ({highest_minutes}:{highest_seconds:02d} from start)"
    )
    logger.info(
        f"Lowest point: {lowest_point} posts at {lowest_time.strftime('%H:%M:%S')} ({lowest_minutes}:{lowest_seconds:02d} from start)"
    )

    ymax = max(y_values) if y_values else 0
    label_y = int(ymax * 0.8)

    # Calculate some start and end labels
    start_date_str = datetime.datetime.strftime(event_start, "%H:%M:%S %Z")
    end_date_str = datetime.datetime.strftime(event_end, "%H:%M:%S %Z")
    # Position the start label to the left of the start line with right justification
    ax.text(
        event_start - datetime.timedelta(minutes=2),
        label_y,
        f"{start_label}\n{start_date_str}",
        horizontalalignment="right",
    )
    # Position the end label 5 minutes after the end, to look good.
    ax.text(
        event_end + datetime.timedelta(minutes=2),
        label_y,
        f"{end_label}\n{end_date_str}",
    )
    ax.axvline(x=event_start, color="r", ls="--", label="start")
    ax.axvline(x=event_end, color="g", ls="--", label="end")
    ax.xaxis.set_major_locator(mdates.HourLocator(interval=1))
    ax.xaxis.set_major_formatter(mdates.DateFormatter("%H:%M"))
    ax.yaxis.get_major_locator().set_params(integer=True)

    # Graphs go into the journal directory now
    graphs_dir = create_journal_directory(config)
    if not graphs_dir:
        return

    # Create the graph filename with hashtag-YYYYMMDD pattern
    graph_file_name = os.path.join(graphs_dir, f"{hashtag}-{date_str}.png")
    alt_text_file_name = os.path.join(graphs_dir, f"{hashtag}-{date_str}.txt")

    # Generate alt text description
    # Calculate minutes between start and end time
    event_duration = (event_end - event_start).total_seconds() / 60

    # Find data points between start and end time
    event_mask = (timestamps >= event_start) & (timestamps <= event_end)
    event_timestamps = [ts for i, ts in enumerate(timestamps) if event_mask[i]]

    # Use the previously calculated highest and lowest points
    try:
        # Calculate average posts per minute
        avg_posts_per_minute = len(event_timestamps) / max(
            event_duration, 0.001
        )  # Avoid division by zero
        nice_date = datetime.datetime.strftime(event_start, "%A, %e %b %Y")

        # Format the alt text
        alt_text = f"""
A histogram showing posts per minute on {nice_date}. Each bar represents one minute. \
The event was {event_duration:.1f} minutes long. There were {len(event_timestamps)} \
posts during the event with an average of {avg_posts_per_minute:.2f} posts per minute.
"""

        # Add histogram-based statistics using our calculated values
        highest_relative = highest_time - event_start
        highest_minutes = int(highest_relative.total_seconds() // 60)
        highest_seconds = int(highest_relative.total_seconds() % 60)

        lowest_relative = lowest_time - event_start
        lowest_minutes = int(lowest_relative.total_seconds() // 60)
        lowest_seconds = int(lowest_relative.total_seconds() % 60)

        alt_text += f"""
The busiest moment was at {highest_minutes}:{highest_seconds:02d} from the start \
with {highest_point} posts in that minute. The quietest moment was at \
{lowest_minutes}:{lowest_seconds:02d} from the start with {lowest_point} \
posts in that minute. The yellow line is a 15-minute moving average."""

    except Exception as e:
        logger.warning(f"Error calculating post statistics for alt text: {e}")
        # Fallback to simpler statistics
        alt_text = f"""
A histogram showing posts per minute on
{datetime.datetime.strftime(event_start, "%A, %e %b %Y")}. Each bar represents \
one minute. There were {len(event_timestamps)} posts during the event. """

    # Save the graph
    try:
        plt.savefig(graph_file_name, format="png")

        # Save the alt text to a file
        with open(alt_text_file_name, "w") as alt_file:
            alt_file.write(alt_text)
            logger.info(f"Saved alt text to {alt_text_file_name}")

    except Exception as e:
        logger.error(f"Failed to save {graph_file_name} and/or {alt_text_file_name}")
        logger.error(e)